$PXP - Multi Puhunan Bagger (MPB)
Philex Petroleum Corporation
November 2016
Positioned: AEP 2.99 since 05/05/2015, Exposure: 13.43% (Refilled)October Highlight: P3.72 (O) | 4.75 (H) | 3.65 (L) | 4.02 (C)
| Date | Last | High | Low | Vol | Change | MPB | D.RSI | D.MACD | W.RSI | W.MACD |
|---|---|---|---|---|---|---|---|---|---|---|
| 11/14 | 3.63 | 3.78 | 3.60 | 1.82M | -3.97% | 0.20 | 44.16 | -0.0088 | 51.15 | 0.1639 |
| 11/15 | 3.60 | 3.70 | 3.59 | 2.47M | -0.83% | 0.19 | 43.45 | -0.0123 | 50.61 | 0.161 |
| 11/16 | 3.60 | 3.70 | 3.59 | 2.02M | 0.00% | 0.19 | 43.45 | -0.0287 | 50.61 | 0.161 |
| 11/17 | 3.62 | 3.78 | 3.59 | 7.56M | +0.56% | 0.20 | 44.14 | -0.0396 | 50.97 | 0.1631 |
| 11/18 |
| Date | Last | High | Low | Vol | Change | MPB | D.RSI | D.MACD | W.RSI | W.MACD |
|---|---|---|---|---|---|---|---|---|---|---|
| 11/07 | 3.90 | 4.00 | 3.89 | 877K | 0.00% | 0.29 | 51.10 | 0.0725 | 56.47 | 0.1988 |
| 11/08 | 4.02 | 4.10 | 3.85 | 2.23M | +3.08% | 0.33 | 54.24 | 0.0735 | 58.31 | 0.2084 |
| 11/09 | 3.76 | 4.07 | 3.65 | 5.24M | -6.47% | 0.25 | 47.17 | 0.0528 | 53.69 | 0.1877 |
| 11/10 | 3.90 | 4.00 | 3.82 | 2.07M | +3.72% | 0.29 | 50.88 | 0.0471 | 56.47 | 0.1988 |
| 11/11 | 3.78 | 3.86 | 3.70 | 1.46M | -3.08% | 0.25 | 36.51 | 0.0234 | 38.74 | 0.0097 |
| Date | Last | High | Low | Vol | Change | MPB | D.RSI | D.MACD | W.RSI | W.MACD |
|---|---|---|---|---|---|---|---|---|---|---|
| 10/31 | H | O | L | L | O | W | E | E | N | ! |
| 11/01 | H | O | L | I | D | A | Y | ! | ! | ! |
| 11/02 | 3.80 | 4.02 | 3.78 | 6.03M | -5.47% | 0.27 | 48.60 | 0.1148 | 54.60 | 0.1957 |
| 11/03 | 3.82 | 3.57 | 3.90 | 5.77M | +0.53% | 0.27 | 49.09 | 0.0936 | 54.96 | 0.1973 |
| 11/04 | 3.90 | 3.92 | 3.83 | 1.49M | +2.09% | 0.29 | 51.10 | 0.0823 | 56.47 | 0.2036 |
October 2016
Positioned: AEP 2.99 since 05/05/2015, Exposure: 13.43% (Refilled)September Highlight: P3.35 (O) | 3.75 (H) | 2.80 (L) | 3.69 (C)
| Date | Last | High | Low | Vol | Change | MPB | D.RSI | D.MACD | W.RSI | W.MACD |
|---|---|---|---|---|---|---|---|---|---|---|
| 10/24 | 3.92 | 4.02 | 3.87 | 4.82M | +1.03% | 0.30 | 53.54 | 0.1491 | 57.48 | 0.1988 |
| 10/25 | 4.26 | 4.30 | 3.95 | 11.48M | +8.67% | 0.41 | 60.40 | 0.1638 | 61.92 | 0.2260 |
| 10/26 | 4.04 | 4.34 | 4.04 | 6.23M | -5.16% | 0.34 | 54.77 | 0.156 | 59.18 | 0.209 |
| 10/27 | 4.10 | 4.25 | 4.04 | 6.98M | +1.49% | 0.34 | 55.97 | 0.1529 | 59.95 | 0.2132 |
| 10/28 | 4.02 | 4.24 | 3.96 | 2.93M | -1.95% | 0.33 | 53.91 | 0.1423 | 58.89 | 0.2068 |
| Date | Last | High | Low | Vol | Change | MPB | D.RSI | D.MACD | W.RSI | W.MACD |
|---|---|---|---|---|---|---|---|---|---|---|
| 10/17 | 4.16 | 4.26 | 4.08 | 11.95M | +5.32% | 0.38 | 66.07 | 0.1444 | 60.92 | 0.2180 |
| 10/18 | 4.04 | 4.24 | 4.00 | 9.87M | -2.88% | 0.34 | 61.33 | 0.1521 | 59.41 | 0.2084 |
| 10/19 | 4.45 | 4.75 | 4.40 | 58.02M | +10.15% | 0.48 | 69.48 | 0.1892 | 64.14 | 0.2411 |
| 10/20 | 4.02 | 4.21 | 3.99 | 24.70M | -9.66% | 0.33 | 56.16 | 0.1817 | 59.15 | 0.2068 |
| 10/21 | 3.88 | 4.15 | 3.87 | 11.61M | -3.48% | 0.29 | 52.65 | 0.1627 | 56.90 | 0.196 |
| Date | Last | High | Low | Vol | Change | MPB | D.RSI | D.MACD | W.RSI | W.MACD |
|---|---|---|---|---|---|---|---|---|---|---|
| 10/10 | 3.86 | 3.95 | 3.80 | 1.44M | +0.2597% | 0.28 | 60.81 | 0.1089 | 57.02 | 0.1856 |
| 10/11 | 3.89 | 4.05 | 3.80 | 6.01M | +0.78% | 0.29 | 61.61 | 0.1194 | 57.42 | 0.1880 |
| 10.12 | 3.78 | 3.95 | 3.76 | 4.70M | -2.83% | 0.25 | 57.01 | 0.1174 | 55.65 | 0.1792 |
| 10/13 | 3.71 | 3.79 | 3.66 | 2.32M | -1.85% | 0.23 | 54.24 | 0.1089 | 54.46 | 0.1736 |
| 10/14 | 3.95 | 4.07 | 3.71 | 12.24M | +6.47% | 0.31 | 61.20 | 0.1202 | 58.20 | 0.1927 |
| Date | Last | High | Low | Vol | Change | MPB | D.RSI | D.MACD | W.RSI | W.MACD |
|---|---|---|---|---|---|---|---|---|---|---|
| 10/03 | 3.89 | 4.02 | 3.72 | 18.87M | +5.42% | 0.29 | 65.64 | 0.0021 | 57.38 | 0.1823 |
| 10/04 | 3.78 | 3.97 | 3.76 | 6.39M | -2.83% | 0.25 | 61.07 | 0.0470 | 55.97 | 0.1736 |
| 10.05 | 3.65 | 3.88 | 3.65 | 3.84M | -3.44% | 0.21 | 56.11 | 0.0556 | 52.51 | 0.143 |
| 10/06 | 3.90 | 3.95 | 3.72 | 5.76M | +6.85% | 0.29 | 62.44 | 0.0816 | 57.51 | 0.183 |
| 10/07 | 3.85 | 4.13 | 3.81 | 7.88M | -1.28% | 0.28 | 60.55 | 0.0971 | 56.88 | 0.1791 |
September 2016
Positioned: AEP 2.99 since 05/05/2015, Exposure: 13.43% (Refilled)August Highlight: P4.04 (O) | 4.15 (H) | 3.30 (L) | 3.36 (C)
| Date | Last | High | Low | Vol | Change | MPB | D.RSI | D.MACD | W.RSI | W.MACD |
|---|---|---|---|---|---|---|---|---|---|---|
| 09/26 | 3.48 | 3.62 | 3.30 | 10.55M | +5.14% | 0.15 | 54.46 | -0.1070 | 51.85 | 0.1526 |
| 09/27 | 3.34 | 3.59 | 3.33 | 3.14M | -4.02% | 0.11 | 49.07 | -0.0918 | 49.70 | 0.1414 |
| 09/28 | 3.33 | 3.40 | 3.33 | 1.31M | -0.299% | 0.11 | 48.70 | -0.0797 | 49.54 | 0.1406 |
| 09/29 | 3.50 | 3.69 | 3.50 | 6.18M | +5.11% | 0.16 | 54.93 | -0.0557 | 52.14 | 0.1542 |
| 09/30 | 3.69 | 3.75 | 3.51 | 4.25M | +5.43% | 0.22 | 60.68 | -0.0212 | 54.75 | 0.1694 |
| Date | Last | High | Low | Vol | Change | MPB | D.RSI | D.MACD | W.RSI | W.MACD |
|---|---|---|---|---|---|---|---|---|---|---|
| 09/19 | 3.09 | 3.20 | 3.06 | 1.46M | -4.04% | 0.03 | 38.58 | -0.2075 | 45.98 | 0.1532 |
| 09/20 | 3.11 | 3.16 | 3.09 | 1.52M | +0.65% | 0.03 | 39.46 | -0.1979 | 46.25 | 0.1547 |
| 09/21 | 3.19 | 3.34 | 3.15 | 2.51M | +2.57% | 0.06 | 43.00 | -0.1817 | 47.38 | 0.1611 |
| 09/22 | 3.27 | 3.41 | 3.25 | 2.99M | +2.51% | 0.08 | 46.37 | -0.1606 | 48.60 | 0.1675 |
| 09/23 | 3.31 | 3.41 | 3.28 | 4.88M | +1.22% | 0.10 | 48.02 | -0.1390 | 49.22 | 0.1707 |
| Date | Last | High | Low | Vol | Change | MPB | D.RSI | D.MACD | W.RSI | W.MACD |
|---|---|---|---|---|---|---|---|---|---|---|
| 09/12 | H | O | L | I | D | A | Y | ! | ! | ! |
| 09/13 | 2.92 | 3.05 | 2.90 | 2.84M | -4.26% | -0.03 | 21.88 | -0.249 | 44.28 | 0.2589 |
| 09/14 | 2.84 | 2.92 | 2.80 | 2.68M | -2.74% | -0.05 | 20.31 | -0.2624 | 43.18 | 0.2505 |
| 09/15 | 3.29 | 3.50 | 2.87 | 13.06M | +15.85% | 0.09 | 44.46 | -0.2340 | 48.84 | 0.214 |
| 09/16 | 3.22 | 3.41 | 3.21 | 3.30M | -2.13% | 0.07 | 42.31 | -0.2147 | 47.81 | 0.2086 |
| Date | Last | High | Low | Vol | Change | MPB | D.RSI | D.MACD | W.RSI | W.MACD |
|---|---|---|---|---|---|---|---|---|---|---|
| 09/05 | 3.20 | 3.30 | 3.20 | 1.88M | 0.00% | 0.06 | 28.47 | -0.2074 | 47.13 | 0.275 |
| 09/06 | 3.20 | 3.31 | 3.20 | 1.48M | 0.00% | 0.06 | 28.47 | -0.2142 | 47.13 | 0.275 |
| 09/07 | 3.14 | 3.28 | 3.13 | 1.43M | -1.87% | 0.04 | 26.95 | -0.2219 | 46.32 | 0.27 |
| 09/08 | 3.08 | 3.18 | 3.02 | 2.16M | -1.91% | 0.02 | 25.49 | -0.2302 | 45.53 | 0.2655 |
| 09/09 | 3.05 | 3.20 | 3.00 | 3.81M | -0.97% | 0.01 | 24.77 | -0.2365 | 45.15 | 0.2632 |
Finally, the month of Au-"Ghost" is gone along with my paper profits which peaked at MPB 1.34 at the beginning of this ghostly month. And we're now in the "BER" months and I can see this stock still is one of the yearend big flyers.
August 2016
Positioned: AEP 2.99 since 05/05/2015, Exposure: 13.43% (Refilled)July Highlight: P4.15 (O) | 5.70 (H) | 3.90 (L) | 4.00 (C)
| Date | Last | High | Low | Vol | Change | MPB | D.RSI | D.MACD | W.RSI | W.MACD |
|---|---|---|---|---|---|---|---|---|---|---|
| 08/29 | H | O | L | I | D | A | Y | ! | ! | ! |
| 08/30 | 3.47 | 3.65 | 3.39 | 6.16M | -4.67% | 0.15 | 34.83 | -0.1357 | 50.82 | 0.3678 |
| 08/31 | 3.36 | 3.48 | 3.30 | 2.44M | -3.17% | 0.12 | 32.05 | -0.1536 | 47.13 | 0.346 |
| 09/01 | 3.21 | 3.35 | 3.18 | 2.99M | -4.46% | 0.06 | 28.68 | -0.1779 | 47.13 | 0.346 |
| 09/02 | 3.20 | 3.85 | 3.18 | 3.17M | -0.31% | 0.06 | 28.47 | -0.1957 | 47.13 | 0.346 |
| Date | Last | High | Low | Vol | Change | MPB | D.RSI | D.MACD | W.RSI | W.MACD |
|---|---|---|---|---|---|---|---|---|---|---|
| 08/22 | 3.76 | 3.97 | 3.75 | 2.29M | -3.59% | 0.25 | 42.97 | -0.1071 | 55.36 | 0.442 |
| 08/23 | 3.71 | 3.84 | 3.70 | 1.53M | -1.33% | 0.23 | 41.52 | -0.1102 | 54.56 | 0.438 |
| 08/24 | 3.68 | 3.75 | 3.66 | 2.04M | -0.81% | 0.22 | 40.63 | -0.1137 | 54.09 | 0.435 |
| 08/25 | 3.62 | 3.66 | 3.60 | 1.99M | -1.63% | 0.20 | 38.84 | 0.1200 | 53.16 | 0.4304 |
| 08/26 | 3.64 | 3.66 | 3.60 | 1.28M | +0.55% | 0.21 | 39.79 | 0.1220 | 53.47 | 0.4320 |
| Date | Last | High | Low | Vol | Change | MPB | D.RSI | D.MACD | W.RSI | W.MACD |
|---|---|---|---|---|---|---|---|---|---|---|
| 08/15 | 3.72 | 3.80 | 3.64 | 2.24M | +0.81% | 0.23 | 41.13 | -0.1773 | 57.74 | 0.49 |
| 08/16 | 3.96 | 3.97 | 3.75 | 5.31M | +6.45% | 0.31 | 49.03 | -0.1523 | 57.74 | 0.49 |
| 08/17 | 3.95 | 4.15 | 3.93 | 8.79M | -0.25% | 0.31 | 48.73 | -0.1317 | 57.74 | 0.49 |
| 08/18 | 3.89 | 3.98 | 3.81 | 2.33M | -1.52% | 0.29 | 46.92 | -0.1189 | 57.74 | 0.49 |
| 08/19 | 3.90 | 4.03 | 3.90 | 2.15M | +0.26% | 0.29 | 47.27 | -0.1067 | 57.74 | 0.49 |
| Date | Last | High | Low | Vol | Change | MPB | D.RSI | D.MACD | W.RSI | W.MACD |
|---|---|---|---|---|---|---|---|---|---|---|
| 08/08 | 3.73 | 3.84 | 3.73 | 2.00M | -0.53% | 0.24 | 39.49 | -0.1736 | 55.67 | 0.5344 |
| 08/09 | 3.80 | 3.85 | 3.74 | 2.68M | +1.88% | 0.26 | 41.68 | -0.1723 | 56.61 | 0.5400 |
| 08/10 | 3.73 | 3.81 | 3.70 | 1.61M | -1.84% | 0.24 | 40.12 | -0.1748 | 55.67 | 0.5344 |
| 08/11 | 3.63 | 3.73 | 3.63 | 2.37M | -2.68% | 0.20 | 37.93 | -0.1829 | 54.13 | 0.5264 |
| 08/12 | 3.69 | 3.74 | 3.64 | 3.34M | +1.65% | 0.23 | 40.04 | -0.1823 | 55.04 | 0.5312 |
| Date | Last | High | Low | Vol | Change | MPB | D.RSI | D.MACD | W.RSI | W.MACD |
|---|---|---|---|---|---|---|---|---|---|---|
| 08/01 | 4.00 | 4.10 | 3.98 | 2.93M | 0.00% | 1.34 | 42.82 | -0.0727 | 59.97 | 0.6169 |
| 08/02 | 3.92 | 4.08 | 3.90 | 2.83M | -2.00% | 1.30 | 41.22 | -0918 | 58.64 | 0.6106 |
| 08/03 | 3.60 | 3.90 | 3.50 | 7.77M | -8.16% | 0.19 | 35.53 | -0.1313 | 53.84 | 0.5850 |
| 08/04 | 3.67 | 3.85 | 3.60 | 6.64M | +1.94% | 0.22 | 37.56 | -0.1551 | 54.82 | 0.5906 |
| 08/05 | 3.75 | 3.78 | 3.64 | 3.70M | +2.18% | 0.24 | 39.89 | -0.1656 | 55.99 | 0.5970 |
As expected, the June High at P5.29 was broken in Week 2 July session but failed to hold above P5.00 level mainly due to UNICAP'S Jockeyed play which ruined its potential upswing towards the P6.40 and P10.42 level.

As usual I missed taking any profits at P5.70 level (July High) and I was forced to reduce my position as the chart above speaks louder than words. It's still in the range which currently on the way up again to test the June and July Highs with expected help from Bounce players.
July 2016
Positioned: AEP 1.7 since 05/05/2015, Size: 11.32%June Highlight: P3.81 (O) | 5.29 (H) | 3.80 (L) | 4.11 (C)
| Date | Last | High | Low | Vol | Change | MPB | D.RSI | D.MACD | W.RSI | W.MACD |
|---|---|---|---|---|---|---|---|---|---|---|
| 07/25 | 4.40 | 4.60 | 4.35 | 6.74M | +0.2278% | 1.60 | 49.59 | 0.0712 | 66.97 | 0.6981 |
| 07/26 | 4.20 | 4.41 | 4.18 | 7.73M | -4.55% | 1.46 | 45.68 | 0.0420 | 63.32 | 0.6822 |
| 07/27 | 4.06 | 4.30 | 4.03 | 5.52M | -3.33% | 1.40 | 43.11 | 0.0075 | 60.94 | 0.6710 |
| 07/28 | 3.90 | 4.08 | 3.90 | 8.22M | -3.94% | 1.30 | 40.33 | 0.0324 | 58.43 | 0.6582 |
| 07/29 | 4.00 | 4.15 | 3.90 | 4.46M | +2.56% | 1.34 | 42.82 | 0.0553 | 59.97 | 0.6662 |
| Date | Last | High | Low | Vol | Change | MPB | D.RSI | D.MACD | W.RSI | W.MACD |
|---|---|---|---|---|---|---|---|---|---|---|
| 07/18 | 4.55 | 4.69 | 4.50 | 7.58M | -5.01% | 1.66 | 52.16 | 0.1873 | 69.93 | 0.7322 |
| 07/19 | 4.43 | 4.56 | 4.38 | 6.99M | -2.64% | 1.59 | 50.07 | 0.1577 | 67.61 | 0.7226 |
| 07/20 | 4.50 | 4.64 | 4.44 | 6.86M | +1.58% | 1.63 | 51.80 | 0.1383 | 68.29 | 0.7371 |
| 07/21 | 4.32 | 4.69 | 4.30 | 10.65M | -4.00% | 1.53 | 48.04 | 0.1071 | 65.61 | 0.7138 |
| 07/22 | 4.39 | 4.49 | 4.34 | 4.31M | +1.62% | 1.60 | 49.38 | 0.0871 | 66.87 | 0.7194 |
| Date | Last | High | Low | Vol | Change | MPB | D.RSI | D.MACD | W.RSI | W.MACD |
|---|---|---|---|---|---|---|---|---|---|---|
| 07/11 | 4.66 | 4.76 | 4.58 | 5.85M | +2.42% | 1.73 | 59.52 | 0.1489 | 74.13 | 0.7268 |
| 07/12 | 4.70 | 5.20 | 4.65 | 19.75M | +0.86% | 1.75 | 60.27 | 0.1605 | 74.43 | 0.7299 |
| 07/13 | 5.38 | 5.70 | 4.95 | 65.71M | +14.47% | 2.14 | 70.30 | 0.2219 | 78.68 | 0.7842 |
| 07/14 | 4.68 | 5.40 | 4.51 | 38.73M | -13.01% | 1.74 | 54.93 | 0.2117 | 74.28 | 0.7283 |
| 07/15 | 4.79 | 4.90 | 4.30 | 17.60M | +2.35% | 1.80 | 56.53 | 0.2101 | 75.09 | 0.7371 |
| Date | Last | High | Low | Vol | Change | MPB | D.RSI | D.MACD | W.RSI | W.MACD |
|---|---|---|---|---|---|---|---|---|---|---|
| 07/04 | 4.70 | 4.88 | 4.20 | 19.8M | +13.25% | 1.75 | 62.01 | 0.0982 | 74.35 | 0.7203 |
| 07/05 | 4.50 | 5.00 | 4.45 | 12.14M | -4.26% | 1.63 | 57.16 | 0.1108 | 72.87 | 0.7043 |
| 07/06 | H | O | L | I | D | A | Y | ! | ! | ! |
| 07/07 | 4.62 | 4.79 | 4.50 | 3.88M | +2.67% | 1.70 | 59.25 | 0.1289 | 73.78 | 0.7139 |
| 07/08 | 4.55 | 4.81 | 4.52 | 5.04M | -1.52% | 1.66 | 57.48 | 0.1361 | 72.26 | 0.7083 |
What a manic Monday! Bulls seemed in full force to welcome the DU30 administration despite the unexpected appointment of anti-mining activist GINA LOPEZ as the DENR Secretary. The June ceiling at P5.29 looks an easy target to break this week or next week with potential upswing towards the P6.40 and P10.42 level.

Nothing more to say - it's all in the Chart!
June 2016
| Date | Last | High | Low | Vol | Change | MPB | D.RSI | D.MACD | W.RSI | W.MACD |
|---|---|---|---|---|---|---|---|---|---|---|
| 06/27 | 3.93 | 4.10 | 3.89 | 5.35M | -4.15% | 1.30 | 45.96 | 15.36 | 65.97 | 0.6681 |
| 06/28 | 3.92 | 4.05 | 3.90 | 2.42M | -0.25% | 1.29 | 45.76 | 0.1125 | 65.78 | 0.6673 |
| 06/29 | 3.92 | 4.01 | 3.90 | 2.82M | 0.00% | 1.29 | 45.76 | 0.0791 | 65.78 | 0.6673 |
| 06/30 | 4.11 | 4.33 | 3.92 | 5.57M | +4.85% | 1.41 | 50.42 | 0.0673 | 69.46 | 0.6824 |
| 07/01 | 4.15 | 4.30 | 4.10 | 3.12M | +0.97% | 1.43 | 51.37 | 0.0604 | 69.82 | 0.6856 |
WOW! UK Votes to LEAVE the EU! - Yes, it's the BREXIT that spoiled the party which I thought the closing candle for Week 4 will break and surge above the Fibo 23.6 level in favor of the BREMAIN.

The good news is the Bulls quickly rejected the Bears to close its Week 4 just a hairline above the Fibo 38.2 level which is still technically in the money zone wherein "my money is expected to make MORE money" and I'm expecting come Monday to see more BP Traders and some brave Investors to do some heavy lifting towards its technical resistances as shown in the above chart.
| Date | Last | High | Low | Vol | Change | MPB | D.RSI | D.MACD | W.RSI | W.MACD |
|---|---|---|---|---|---|---|---|---|---|---|
| 06/20 | 4.57 | 4.85 | 4.57 | 6.8M | -1.08% | 1.67 | 59.97 | 0.3969 | 79.93 | 0.7249 |
| 06/21 | 4.07 | 4.63 | 4.03 | 11.82M | -10.94% | 1.38 | 48.92 | 0.3290 | 68.79 | 0.6851 |
| 06/22 | 4.14 | 4.20 | 3.80 | 8.9M | +1.72% | 1.42 | 50.30 | 0.2776 | 70.16 | 0.6906 |
| 06/23 | 4.27 | 4.33 | 4.11 | 4.9M | +3.14% | 1.50 | 52.85 | 0.2446 | 72.85 | 0.7010 |
| 06/24 | 4.10 | 4.41 | 3.88 | 8.35M | -3.98% | 1.40 | 49.29 | 0.2023 | 69.37 | 0.6875 |
The P4.93 ceiling finally got broken in Week 3 with new HoW and LoW at P5.29 and P4.41 respectively. The Bulls are likely to stay in this area as some quickly enjoyed their success through early profit taking but OBV showed some remain and still in position to resume its migration towards the next major ceiling at P6 level.

The new chart above with a bit of fancy coloring showed the Bears retested but came up short to break the Fibo 23.6 level. The confirmed quick bounce ceiling is at P5.29 level. The linemen are in good distances and well aligned with their respective blocking lines but "Expect your money to make MORE money" now that the Bulls are in the money zone.
| Date | Last | High | Low | Vol | Change | MPB | D.RSI | D.MACD | W.RSI | W.MACD |
|---|---|---|---|---|---|---|---|---|---|---|
| 06/13 | 4.55 | 4.60 | 4.41 | 2.3M | -1.09 | 1.66 | 67.15 | 0.4024 | 79.90 | 0.6794 |
| 06/14 | 5.05 | 5.19 | 4.53 | 21.7M | +10.99% | 1.95 | 73.41 | 0.4355 | 83.42 | 0.719 |
| 06/15 | 5.00 | 5.29 | 4.94 | 8.2M | -0.99% | 1.92 | 71.94 | 0.4532 | 83.2 | 0.715 |
| 06/16 | 4.90 | 5.09 | 4.75 | 5.71M | -2.00% | 1.86 | 68.94 | 0.4538 | 82.72 | 0.7072 |
| 06/17 | 4.62 | 4.99 | 4.62 | 7.2M | -5.71% | 1.70 | 61.26 | 0.4269 | 81.25 | 0.6849 |
The Week 2 Daily RSI has been lingering above 60 level while the Weekly RSI has finally break above 80 level for the first time as it closed the week strongly at 81.13 level. The High of Week (HoW) registered a new HoW at P4.72 and Low of Week (LoW) was pegged at P3.95 permanently - both higher and much stronger than Week 1.

The Chart above showed the AOTS formation of MAs still intact and very much respected with strong weekend close at P4.60 which shattered both the minor and mid resistances marked in Week 2 and very much within the striking distance to break the major resistance at P4.93 (52WH) - will it break or not? - abangan!
| Date | Last | High | Low | Vol | Change | MPB | D.RSI | D.MACD | W.RSI | W.MACD |
|---|---|---|---|---|---|---|---|---|---|---|
| 06/06 | 4.40 | 4.40 | 3.95 | 10M | +8.64% | 1.57 | 67.77 | 0.4037 | 79.99 | 0.603 |
| 06/07 | 4.40 | 4.59 | 4.40 | 7.45M | 0.00% | 1.57 | 67.77 | 0.4082 | 79.99 | 0.603 |
| 06/08 | 4.25 | 4.52 | 4.21 | 5.29M | -3.41% | 1.49 | 63.53 | 0.395 | 79.04 | 0.591 |
| 06/09 | 4.43 | 4.49 | 4.25 | 3.6M | +4.24% | 1.59 | 66.26 | 0.3946 | 80.17 | 0.605 |
| 06/10 | 4.60 | 4.72 | 4.33 | 7.9M | +3.84% | 1.69 | 68.65 | 0.4033 | 81.13 | 0.619 |
The opening week for this month seemed to complete the symmetrical triangle formation with bullish bias as it ended with a hammer (hanging man?) while the Brent Crude Oil (BCO) is on course to test its SMA100 level at nearly $60. Week 2 will likely resume its uptrend with probable minor, mid and major bounce points at 4.22, 4.42 and 4.93 (52WH) respectively.

| Date | Last | High | Low | Vol | Change | MPB | D.RSI | D.MACD | W.RSI | W.MACD |
|---|---|---|---|---|---|---|---|---|---|---|
| 05/30 | 3.95 | 4.00 | 3.83 | 2.5M | +1.80% | 1.31 | 63.23 | 0.4467 | 76.89 | 0.519 |
| 05/31 | 3.86 | 4.04 | 3.81 | 3.7M | -2.28% | 1.26 | 61.06 | 0.4221 | 75.84 | 0.512 |
| 06/01 | 4.04 | 4.08 | 3.81 | 5.6M | +4.66% | 1.36 | 63.75 | 0.4117 | 77.55 | 0.526 |
| 06/02 | 4.14 | 4.20 | 4.00 | 4.2M | +2.48% | 1.42 | 65.19 | 0.4074 | 78.23 | 0.534 |
| 06/03 | 4.05 | 4.14 | 3.90 | 5.7M | -2.17% | 1.37 | 62.77 | 0.3922 | 77.62 | 0.527 |
All Year, Monthly


| Disclaimer: All information and insights posted here are based on Puhunan's learning experience as a newly converted TRADER with real stocks open and/or closed positions. This is not a recommendation or to hype any similar stocks but simply a trading journal for purposes of having the ability to access and review it online anywhere anytime. Puhunan takes no responsibilities to any losses you may incur by blindly following or copying any positions, strategies and/or practices you may find useful here. |
MPB Monitor
Positioned: @1.7 since 05/05/2015, Size: 11.32%
| Date | Last | High | Low | Vol | Change | MPB | D.RSI | D.MACD | W.RSI | W.MACD |
|---|---|---|---|---|---|---|---|---|---|---|
| 05/23 | 3.85 | 4.37 | 3.85 | 8.43M | -6.78% | 1.25 | 64.16 | 0.4945 | 75.21 | 0.4617 |
| 05/24 | 3.80 | 3.91 | 3.70 | 7.352M | -1.30% | 1.22 | 63.13 | 0.4829 | 74.51 | 0.4524 |
| 05/25 | 4.04 | 4.19 | 3.90 | 7.516M | +6.32% | 1.30 | 65.96 | 0.8462 | 80.31 | 0.4716 |
| 05/26 | 4.04 | 4.15 | 4.01 | 3.49M | 0.00% | 1.36 | 65.97 | 0.4821 | 80.32 | 0.472 |
| 05/27 | 3.88 | 4.22 | 3.84 | 8.044M | -3.96% | 1.27 | 62.26 | 0.4616 | 76.35 | 0.459 |
For the month of May, this stock showed a major activity in terms of volume and price action. The last candle appeared bearish but weak as it ended as an inside bar (insurance candle?). However, the long term trend of this stock on its 2-Year Weekly chart showed its upward momentum is held at its closing price of P3.88 which is still within the Fibo 50% and way above the EMA 10.
The previous week's high at P4.93 pierced strongly above the SMA 100 and Fibo 61.8% just above the March 2015 high of P4.70 marked as the initial tip of the BIG cup (bowl?) pattern - a seemingly good sign of its uptrend direction to complete its full formation at P6.44 with a potential BIG move towards its main handle at P8.55 which likely to happen if it breaks the P4.93 sooner or later within week one next month. Otherwise, the expected minor, mid and major pullbacks will be at its EMA 10, SMA 20 and SMA 50 levels respectively.
The previous week's high at P4.93 pierced strongly above the SMA 100 and Fibo 61.8% just above the March 2015 high of P4.70 marked as the initial tip of the BIG cup (bowl?) pattern - a seemingly good sign of its uptrend direction to complete its full formation at P6.44 with a potential BIG move towards its main handle at P8.55 which likely to happen if it breaks the P4.93 sooner or later within week one next month. Otherwise, the expected minor, mid and major pullbacks will be at its EMA 10, SMA 20 and SMA 50 levels respectively.

Meanwhile the long term direction of the Brent Crude Oil showed similar upward trend that began in February this year and will likely end the month of May above its recent high of $50.49 since its major decline from $116.26 in June 2014. I'm not so sure of the importance or significance of the correlation of the price movement or trend of this commodity with this stock but one thing I'm sure of now is I'm seeing both patterns are somehow exactly correlated - did you see it too? (If yes, please don't hesitate to comment! - if not, please ask for clue in the comment box or simply stare at both charts then put in comment what you see).

Now that I'm a chart believer and a TA practitioner, I will be holding this stock as its long term pattern and momentum above the SMA 100 is beginning to attract major players which will likely fuel its upward swing straight up to the Fibo 76.4% level.
Never again this stock will end up in the same "sayang" story with my GLO and JFC stocks.
In terms of reacting to the trend of this stock, I'm now flexible with my plan (entry, top-up, exit and re-entry) but if it moves to its next Bagger level sooner or a bit later - I'm ready!
Never again this stock will end up in the same "sayang" story with my GLO and JFC stocks.
In terms of reacting to the trend of this stock, I'm now flexible with my plan (entry, top-up, exit and re-entry) but if it moves to its next Bagger level sooner or a bit later - I'm ready!

"Helping Traders, Succeed." - Rayner Teo
| Disclaimer: All information and insights posted here are based on Puhunan's learning experience as a newly converted TRADER with real stocks open and/or closed positions. This is not a recommendation or to hype any similar stocks but simply a trading journal for purposes of having the ability to access and review it online anywhere anytime. Puhunan takes no responsibilities to any losses you may incur by blindly following or copying any positions, strategies and/or practices you may find useful here. |
MPB 1.41
(Week ended with last 2 Candles with resemblance to Dragonfly Doji - Bullish still?)
Still Positioned: @1.7 since 05/05/2015

Not being greedy, just ICWT.
Still riding it until it reach its intended destination.

BIG CUP still in the making? - more soldiers please!
In Charts, We Trust!
(ICWT 101)
| Disclaimer: All information and insights posted here are based on Puhunan's learning experience as a newly converted TRADER with real stocks open and/or closed positions. This is not a recommendation or to hype any similar stocks but simply a trading journal for purposes of having the ability to access and review it online anywhere anytime. Puhunan takes no responsibilities to any losses you may incur by blindly following or copying any positions, strategies and/or practices you may find useful here. |
MPB 1.30
(Profit taking for two consecutive days.)
Still Positioned: @1.7 since 05/05/2015

Not joining the PT party yet as it still looks poised to shoot up
further to reach or touch my target quota.

BIG CUP in the making?
In Charts, We Trust!
(ICWT 101)

| Disclaimer: All information and insights posted here are based on Puhunan's learning experience as a newly converted TRADER with real stocks open and/or closed positions. This is not a recommendation or to hype any similar stocks but simply a trading journal for purposes of having the ability to access and review it online anywhere anytime. Puhunan takes no responsibilities to any losses you may incur by blindly following or copying any positions, strategies and/or practices you may find useful here. |
MPB 1 Reached!
(Approaching Weekly Patintero Fast Lane at 38.2%!)
Positioned: @1.7 since 05/05/2015

Size: 11.32%

Yes, I know I declared myself as a TRADER!
But I still can't stop blogging about BAGGER!
Thing is BAGGER is a BAGGER.
It’s neither hard to spot nor hard to achieve.

"Invest in what you know."
What to know about $PXP?
It's chaired by MVP.
Everyone knows the man, Mr. PLDT.
M-O sector, down cyclically.
Price, depressed due to incident.
FA done. Easy.
Invested.
Held.
Sell - still riding.
Simple, eh?
Learned it from this man.

Let me share a bit of my secret.

I really want to be a TRADER.
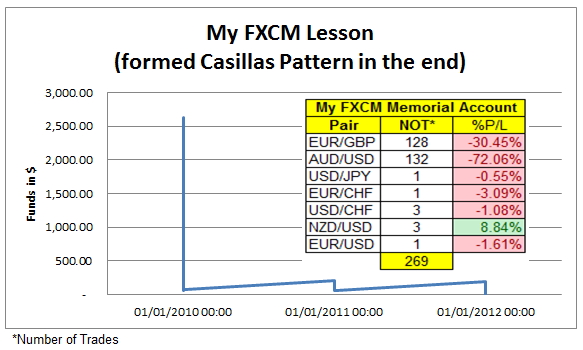
But I'm a failed FX TRADER.
It's why I preferred to INVEST not TRADE stocks
But my success as an INVESTOR is pure hard work.
I READ a lot, not FOLLOWS a lot.
I bought many books, mostly finance books, two shelves so far.
I've never been a member of any FB groups,
Investment GURUS and GINYUSES.
I'm always skeptical of any persons or groups,
real or fictional offering any guarantees of
success in anything.
That's why I'm not an easy prey
to any PRIMAL HUNTERS.

The truth is I’m still hungry for something.
I’m still looking for something.
I’m still Googling for something.
Something about investing or trading
experience, results, strategies or system

that is...
REAL, RELATE-ABLE and DOABLE.
Then I stumbled upon this forum called BookAKA
I just typed Buk... errm Book...
Like you I simply fall into its catchy website name :)
Who wouldn't sign up to it?

I thought there's no harm signing up
to a 50 Shades sound like forum - oh the name!

First login, Boom! Bulaga!
Floods of Charts! TA Sentiments!
Chartists! TA Specialist!
Methinks... Boo! nalugi ako jan!
FX TRADER ako dati!

Seemed like I found the right place to share
and showcase my investing experience/skills.
I honestly thought I can make them rethink
their ways of making money in the stocks.
I sincerely thought to shout and standout
"INVESTOR ako, I'm the BEST!"

Many aims to DYM with their positions, I did!
I really thought I'm the best!
because I studied hard to be one of...

But then I took notice of ZF.
Many seemed to call or address him as "Master."

Since then, as a keen reader I delved into his world
through his blog - finished it from ground up
but still back reading as I found every details on how he's done it
matched every mistakes I've made and other related scenarios not just with stock
but especially with my experience as a failed FX TRADER.
Oh yes, this is it!

So I applied for the ZFT Program.
I desired to be one of the tribe.

I sounded like a Sumbungero but to my surprise,
I’ve got a reply sooner than expected.
And true to his words.

The start has begun.

Why ZFT Ways, ZF?
Frankly, I don't know.
I just found him and his diaries so...
REAL

RELATE-ABLE

and not just textbook but proven
DOABLE

So what? Fan ka na pala ni ZF!
Yeah I know but going back to MPB with $PXP.
I actually made this bagger not through ZFT ways.
I now fully understand how I made it.
I just figured it out.
Though Tortoise like but it's a bagger in a year!
Definitely not my first!
I made multiple MPB since 2008,
but I never thought it could actually be done faster
as a

So you mean, HRT ka na rin?
HRI naman ako dati
as I allocated/invested my Puhunan of
at least 10% of my total Portfolio in a company
until it go bust - ALL IN? why not?
Mukha ngang Position Trader ka!
ZFT ka na ba?

Malalaman natin, sa tamang panahon.
But for now, I have my ZFLens.

You bet!!!
#gigols
| Disclaimer: All information and insights posted here are based on Puhunan's learning experience as a newly converted TRADER with real stocks open and/or closed positions. This is not a recommendation or to hype any similar stocks but simply a trading journal for purposes of having the ability to access and review it online anywhere anytime. Puhunan takes no responsibilities to any losses you may incur by blindly following or copying any positions, strategies and/or practices you may find useful here. |


Found your blog. Enjoy your journey as a HRT
ReplyDeleteHi AC! BIG Thanks for dropping by!
Delete